Cradle to Career Must Reveal Outcomes for California’s Most At-Risk Students
- ERP Communications
- Sep 9, 2024
- 3 min read
California’s new Cradle-to-Career Data System (C2C) has marketed itself as a “longitudinal data system that will illuminate the journey from cradle to career”. It has also claimed that the system “can stitch together data that can tell stories across time...connections and transitions become visible only when the data from multiple education systems is linked together”.
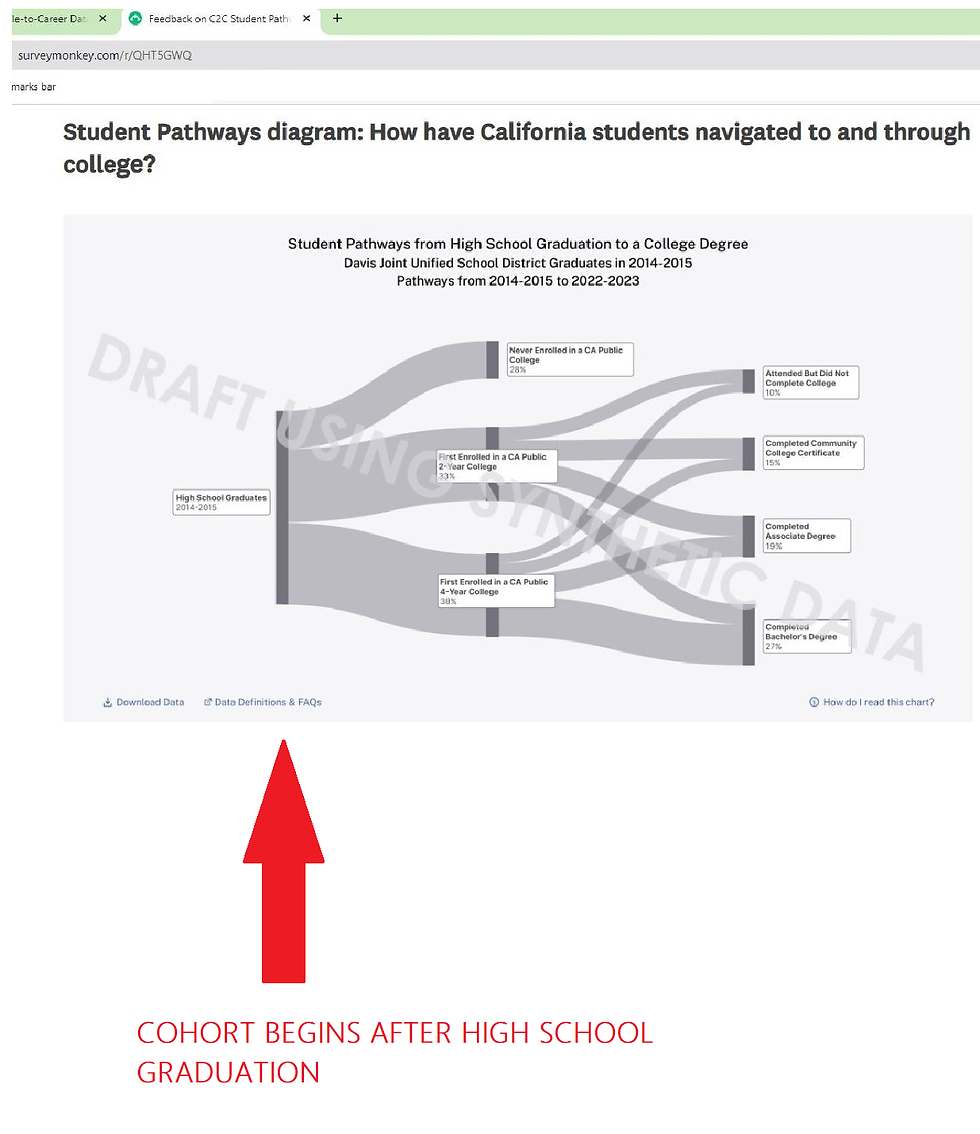
For the data system to live up to the promises of its marketing, the leadership of C2C must take swift and immediate action to fix its draft student pathways diagram showing how California students navigated to and through college. The draft chart is essentially the same Sankey diagram visualization that has already been shared with California school districts for over a decade in a similar student longitudinal data system—California Partnership for Achieving Student Success (Cal-PASS Plus). The major difference is that the C2C’s draft diagram eliminates from its reported outcomes all students who have dropped out of high school (see side by side comparison of both diagrams at the bottom of the page).
Students who do not complete high school are just as important to capture in the data as all other students. If this change is not made in the final version of the chart, the C2C data system would mislead the public about college enrollment and attendance rates—one of Governor Gavin Newsom’s legacy goals, which aims to reach 70% postsecondary attainment by 2030.
The way to fix this clear flaw is to begin following the cohort in 9th grade. This is exactly how the Cal-PASS Plus student data system displayed the data to educational administrators. Using 9th grade enrollment as the denominator when calculating the throughput rate from high school to college, shows Californians:
The actual college-going rate for California’s high school exiters (which is different from the high school completer population).
How many students made it through high school and enrolled/completed postsecondary education by race, poverty level, region, etc.
The number of students who did not complete high school and what happened to them over time.
Demographics and characteristics of high school dropouts which is valuable for conducting an analysis on potential solutions.
For over a decade, more than 1,500 educational institution leaders and employees had access to this type of throughput analysis using Cal-PASS Plus. Cal-PASS Plus was a voluntary longitudinal data system that existed long before C2C and provided its users with essentially the same information. It was created through a partnership with the California Community Colleges Chancellor’s Office, San Joaquin Delta College and the nonprofit organization Educational Results Partnership. While Cal-PASS Plus certainly had its limitations considering it was a voluntary system of data sharing (bottom up with user buy-in) rather than a state mandated one (top down and required), it helped participating school districts get the same information C2C markets itself to provide at a fraction of the cost but with one glaring difference—what happens to the population of students that drop out of high school?
In a state as progressive as California, it should not require advocacy to prioritize including high school dropouts in any longitudinal data chart. It should be an obvious norm for anyone working with data in this state, especially for anyone involved in developing a longitudinal data system. The consequences of not displaying high school dropouts on the student pathways diagram are severe and far-reaching. By excluding this information, we would be creating a misleading narrative about postsecondary enrollment rates.
Without accurate data that includes the high school dropout population, policymakers and educators are not getting the full picture and are certainly not being told a story "across time". Moreover, not capturing these data perpetuates systemic inequities, as it obscures the struggles of our most vulnerable students, often from marginalized communities. Ignoring the reality of high school dropouts and their needs undermines efforts to address educational disparities and ultimately fails to prepare our workforce for the future and does nothing to “illuminate their journey”.
The C2C Data System should include all students in its data visualizations to truly illuminate the journey from cradle to career and accurately measure which students are being left behind. If C2C cannot make this fundamental change immediately, then it is not doing what it is supposed to be doing for the tens of millions of taxpayer dollars that have been invested in the system.
Example of Cal-PASS Plus Original Sankey Diagram Starting in 9th Grade and including all high schoolers in the calculation.

Draft Cradle to Career Sankey Diagram excluding high school dropouts from the calculation.


Comments